 Your new post is loading...
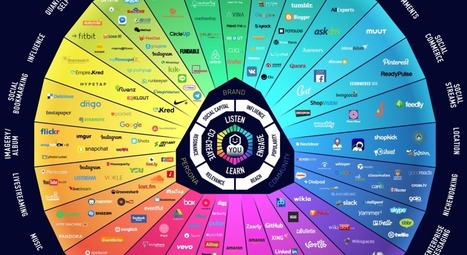
The incredible growth of this social media universe can be largely attributed to the success of Facebook, which has recently hit two billion active users globally. But, of course, there are many other platforms that have helped to build the foundation as well – names like YouTube, Messenger, WhatsApp, LinkedIn, Reddit, Twitter, Snapchat, and Instagram all create a powerful base for new apps and add-ons to plug into. As of today, entrepreneurs have been able to use this foundation to build out new branches to the social media universe that are both exciting and diverse. The apps in these niches help to facilitate workplace collaboration, live events, dating, networking, user reviews, location-based marketing, livestreaming, expert Q&As, and many other functions – and the ecosystem continues to expand and multiply by the day....
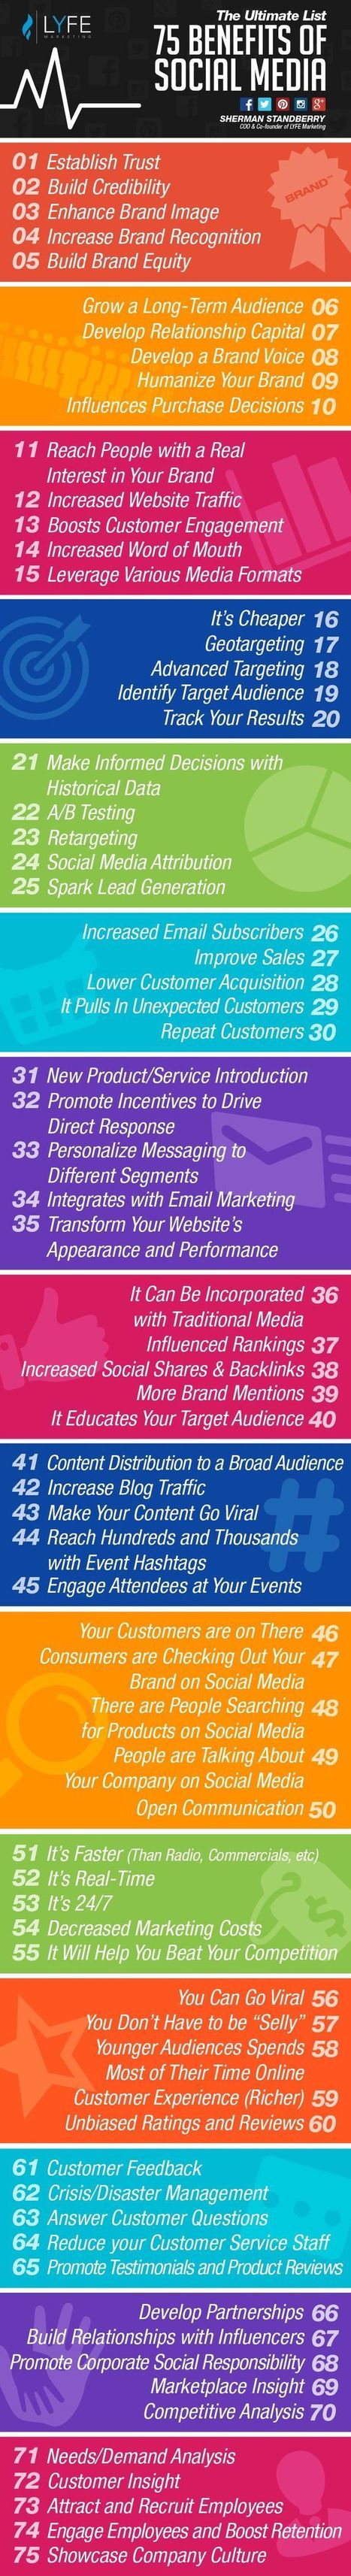
How many benefits of social marketing can you think of?
Social media can be used in so many ways – to develop your brand, increase SEO rankings, distribute content, acquire leads, and more. While many blogs talk about these benefits, there are very few that attempt to outline the “big picture” of social media or a comprehensive list of its benefits.
I decided to take a stab at it and ended up with 75 benefits of social media marketing. Below is an infographic with a compiled list of benefits. Check it out and see which benefits your brand is potentially missing on social media....
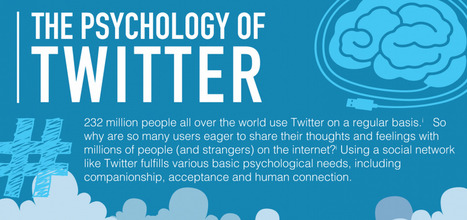
In an age where millions of people document their lives online, it begs the question: what are the psychological reasons behind Twitter? Read more about the psychology of social media here.
There’s no question of a doubt that social media has become more visual over the past few years with over 63 percent of social media updates now incorporating images. This means that if you don’t have great images for your social updates you will not stand out from the hundreds of status updates streaming past your audience every day.
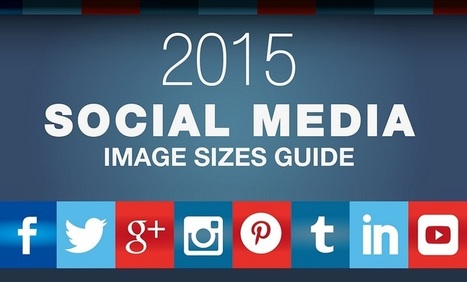
But simply having great images is not enough.Unfortunately your photos and images display differently across the different social media channels so you need to make sure that your photos are optimized for each one. This can often lead to a lot of searching online to find out the correct dimensions for Facebook, Twitter, Instagram etc.
Wouldn’t it be useful if all this information was in one place? Thankfully the team at Setupablogtoday have done that in this easy to follow cheat sheet.
Whether you are an experienced Social Media Marketer or a novice this handy reference guide lists the dimensions for the images which the major social networks want you to use, as well as a few handy tips for selecting the perfect image for your profiles....
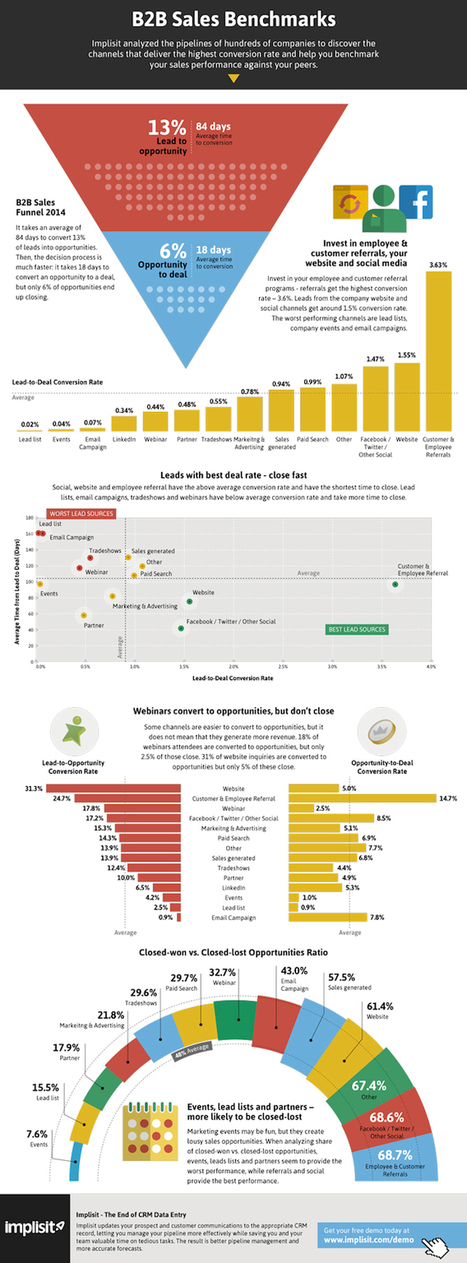
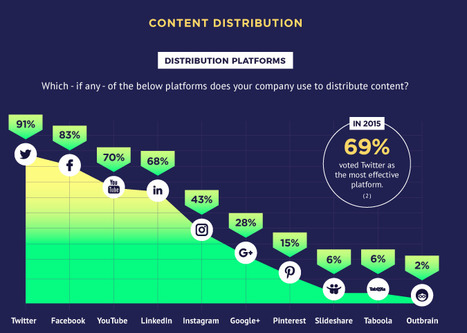
If you're a sales or marketing leader, you've probably already wrapped up strategy planning for 2015. (Or you might still be in the thick of it if time hasn't been on your side. No judgment -- I've been there.) But a new infographic from Implisit which reveals the most and least effective channels for customer conversion might prompt you to crack the newly approved plans open once more and make a few revisions.
For instance, if you intend on finding customers through events and purchased lead lists in the new year, you might want to think again, as these channels had the lowest lead to conversion rate of 14 options. On the opposite end of the spectrum were Facebook and Twitter, company website, and referrals, the last of which blew all other channels out of the water with 3.63% of leads converting to customers. These same avenues were also far more likely to result in closed-won vs. closed-lost deals....
Have you ever wondered when you should be sharing your content on the social web?
Your visitors and followers prefer using social media sites during specific hours. So if you start sharing your content when your users are on these social sites, you’ll not only gain more shares, but you’ll also notice an increase in traffic.
So, when should you be sharing your content? Well, just follow the times in the infographic below....
We all know a picture speaks thousand words and for that reason infographics are being more popular due to its amazing information displayed in the form of images. It has the capability to capture everyone’s eye and tell them a story with engaging content and images. It’s an all in one package with text, images and creative design that come all along. It holds a great marketing potential that has the ability to attract customers. Many people click on infographics as it is more appealing and hence your web traffic is increased which is beneficial aspect for SEO.
Here we have the collection of 10 interesting infographics about social media. Let’s have a look at them below.
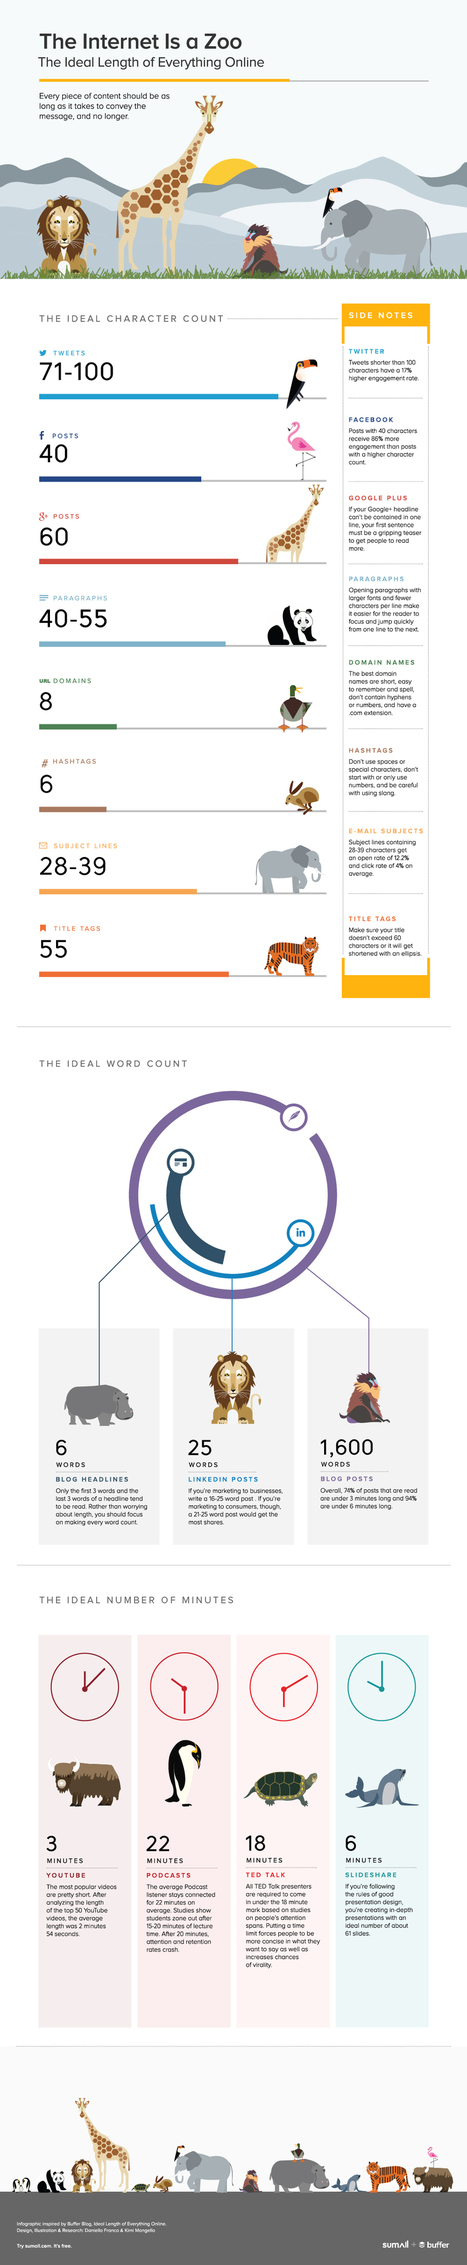
How long should my tweet be? Or my blogpost? Or my headline?
I ask this question a lot. It seems that others do, too. Our first take on coming up with the ideal length of all online content proved quite useful for a lot of people.
I’d love to see if I can help make it even more useful.
Along with all the best tips on optimal lengths for tweets, blogposts, headlines, and more, I’ve added a few additional lengths to the list—the ones that came up most often in the comments of the last post, like SlideShare length, Pinterest length, and more.
And to make it just as easy as possible to consume all this information quickly and easily, we partnered with our friends at SumAll to place the data and insights into a fun infographic. Check it all out below.
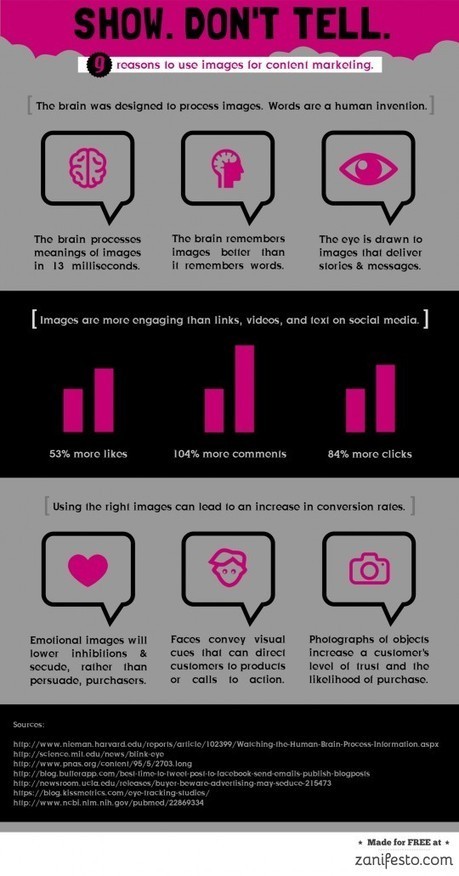
Visual social media posts get more engagement than text, but this rule goes for all content marketing pieces.
What people are sharing and how they’re sharing it is changing fast. A new infographic from Go-Gulf, a web design team based in Dubai, has gathered the latest data, which is now available in this newly released (July 2014) social media infographic. Here are the highlights…
Via Lauren Moss, Jeff Domansky
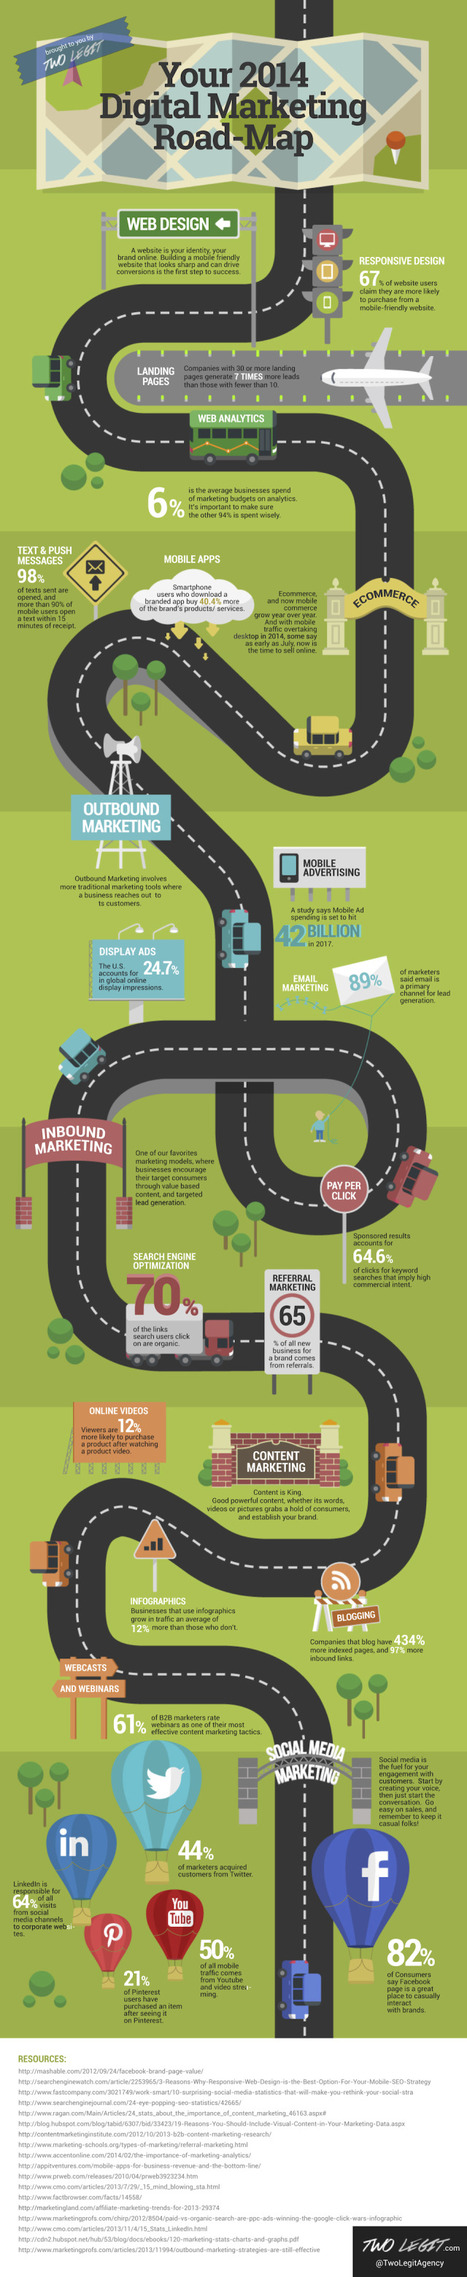
Sometimes it’s easier to just follow the dotted line as you’re looking to ensure your digital marketing is balanced and complete. This infographic compliments of Two Legit aims to do just that, walking you through your web presence, mobile, ecommerce, outbound, inbound, content and social media marketing initiatives.
One element lost in this infographic is the ability for all of the strategies to work with one another. For instance, utilizing your content marketing to power newsletters that are optimized for mobile devices.
That’s not defined in this infographic but it’s an absolute necessity if you’d like to fully leverage email and ensure your emails are read properly. I’ve written before that the modern digital media consultant is more of a conductor, balancing the volumes of each strategy to make some sweet, sweet music!
More often than not, we find that the key to marketing well isn’t doing everything… it’s balancing a combination of strategies, amplifying the impact by having them work together, and understanding how much of each strategy to initiate in order to maximize results. That said – this is still a great checklist to go down and ensure you’re not missing anything! This infographic also provides some statistics behind the digital marketing trends....
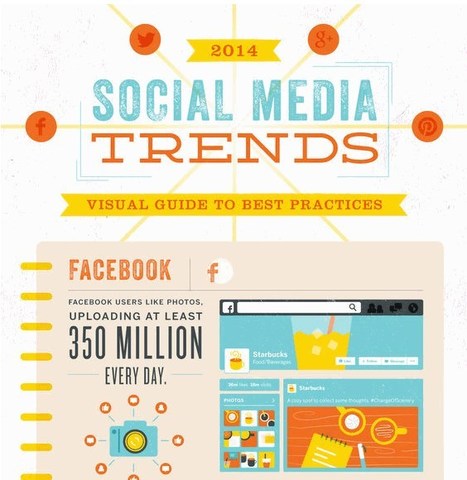
The world of social media is ever-changing. It’s important to keep current on best practices to ensure that you’re doing all you can to keep your marketing campaigns and initiatives fresh.
The team at Vocus has researched the latest and greatest trends in marketing on Facebook, Twitter, Google+, Flickr, Pinterest, Instagram, Vine, LinkedIn, and YouTube. Here’s what they found:...
We love visual content. In an ever-changing world of digital marketing, visual content can help provide a look into quick tips and tricks around engaging topics in one colorful and compact package.
With this in mind, what’s better than an infographic?
There are many varieties of infographics available that surround the topics of Digital Marketing and Social Media. To help sort through the volume, we’ve picked out five infographics your brand can use for developing and improving your content strategy....
|
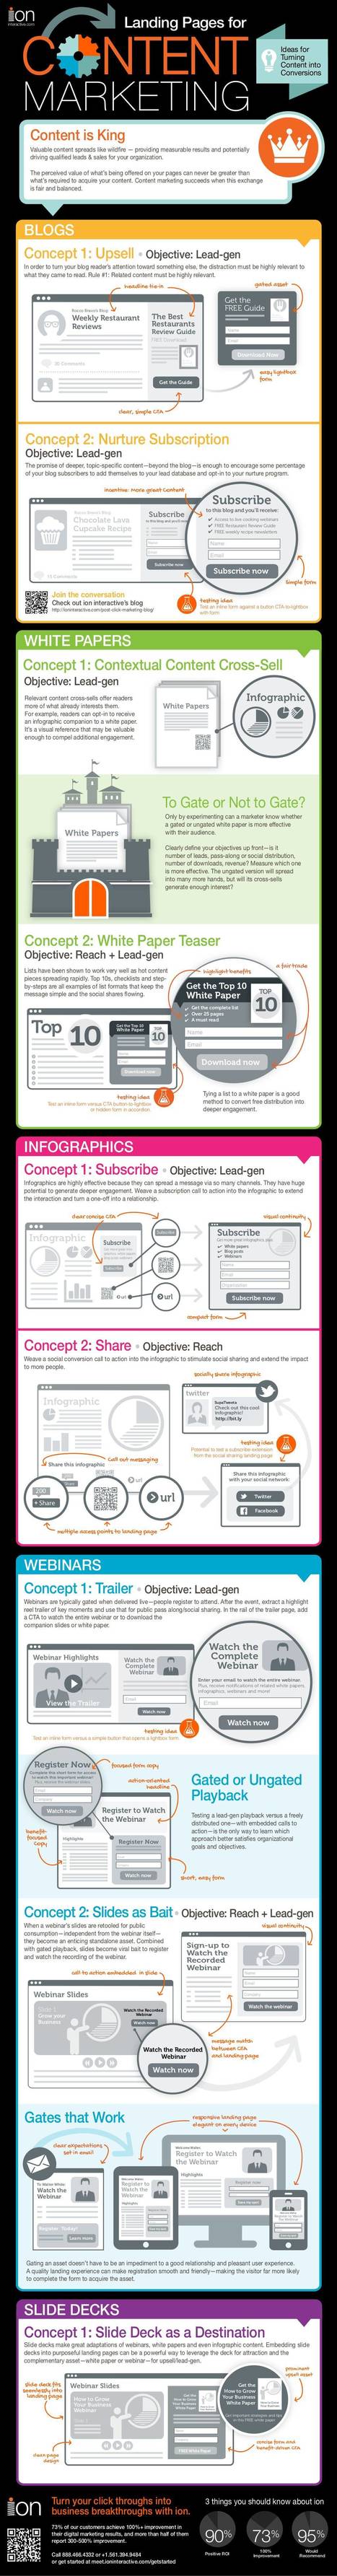
"Less than 10% of those surveyed were definitely sure how to implement content marketing." Sound familiar? If it does, you're clearly not alone. Content marketing -- and keeping up with it -- can be confusing, even to those who understand its importance. Many of us have heard the phrase "content is king." But what, exactly, does that look like here and now, in such a rapidly changing landscape? We grabbed that opening statistic from the helpful, intriguing infographic below, compiled by Zazzle, based on the results of its 2017 State of Content Marketing Survey of marketers in the UK. But instead of simply looking at the latest trends, it sought to examine the pain points and decision-making process of today's content marketer. And if you're in the business of making life easier for that audience -- well, we suggest having a look. Do you think the same trends hold true in your neck of the woods? Read on, and see where your current strategy and priorities align with the data illustrated here....
There are lots of things you need to do to have a successful blog. Not only do your posts need to be well-written, helpful, and relevant to your target audience, but you've also got to make sure you're promoting them correctly so they get in front of people who could become your fans -- and maybe even your customers.
Luckily, you have many creative options when it comes to promoting your blog content. In the infographic below from ReferralCandy, we hear from over 40 marketing experts about their favorite blog promotion tactics -- everything from relationship building to email segmentation to social media. Check it out....
Maintaining a steady stream of content that's unique and interesting to your target audience is a challenge. But with a big dose of creativity (and a little help from content idea generators), you can create content that's not only valuable to your market, but also stands out from the sea of information.
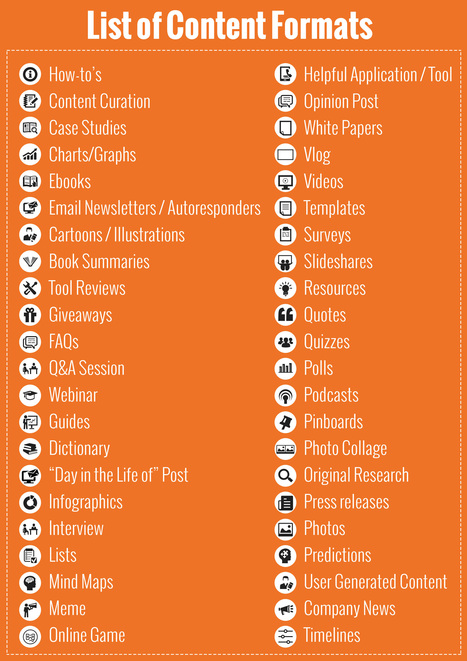
44 Fantastic Types of Content
There are tons of options out there for content you can create. Forty four content types are outlined below, so look through the list and see which ones would make a perfect fit in your marketing plan....
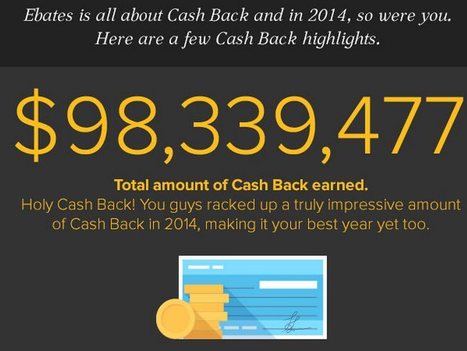
Cashback industry leader eBates had a phenomenal year, returning $98,339,477 to consumers. Consumers are now embracing cashback programs and merchants are seeing the benefits of this powerful marketing strategy in driving sales. The future strength of the cashback industry is further reflected in the purchase of eBates for more than $1 billion by Japanese conglomerate Rakuten.
We live in an age of Big: Big Computers, Big Data, and Big Lies.
Faced with an unprecedented torrent of information, data scientists have turned to the visual arts to make sense of big data. The result of this unlikely marriage—often called "data visualizations" or "infographics"—has repeatedly provided us with new and insightful perspectives on the world around us.
However, time and time again we have seen that data visualizations can easily be manipulated to lie. By misrepresenting, altering, or faking the data they visualize, data scientists can twist public opinion to their benefit and even profit at our expense.
We have a natural tendency to trust images more than text. As a result, we’re easily fooled by data visualizations. But fortunately, there are three easy steps we can follow to save ourselves from getting duped in the data deluge....
The key finding: Holiday shoppers are increasingly seeking out gift ideas on social – and they’re relying less and less on traditional channels. Nearly two-thirds of holiday shoppers say they use social to find gift inspiration (up 25% year-over-year), while those who say they lean on traditional media (like TV commercials and magazine ads) fell 22% from 2013.
Shoppers say Facebook is the most influential platform when it comes to holiday purchases: 59% of consumers cited Facebook as having the most influence on their purchases in 2014 – up 51% year-over-year.
Peer recommendations on social media continue to influence gift purchases more so than other types of recommendations and endorsements. Nearly 70% of respondents said social content and commentary about brands and/or products from their peers influence their purchases most – a figure that’s more than 6X higher than those who said celebrity endorsements on TV carry the most weight (11%)...
ALanding Pages for Content Marketing
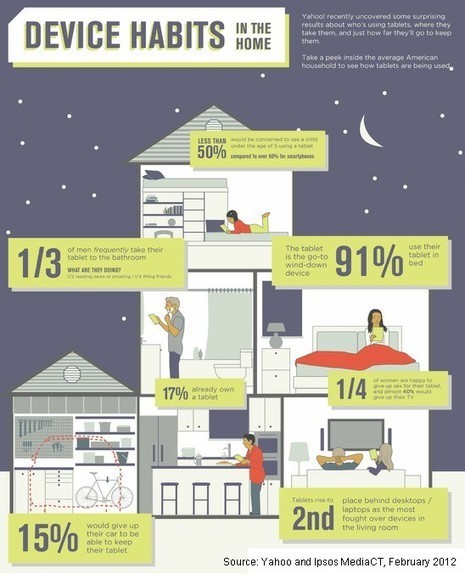
Americans are in love with their tablets: 91% of people who own a tablet say they take their device to bed with them, and 15% say they would give up their car in order to keep their tablet, according to survey from Yahoo and Ipsos MediaCT.
Moreover, 25% of female tablet owners say they'd happily give up sex to keep their devices. And what do men have to say about that? One-third of them are in the bathroom—with their tablets, sending email (50%) and instant messages to friends (25%)....
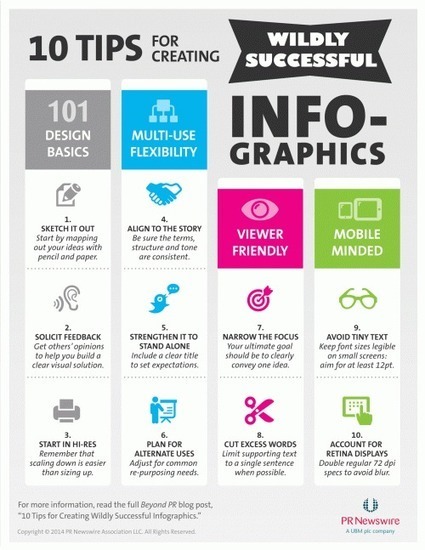
Infographics are playing a larger role in visual storytelling efforts. When they are thoughtfully designed, they provide attention-grabbing visuals that also help the reader better comprehend and remember the message. This added value to the reader often encourages further engagement and sharing.
Based on my experience creating infographics that are used in PR Newswire’s press releases, blog posts and presentations, here are some best practices for designing infographics that drive results....
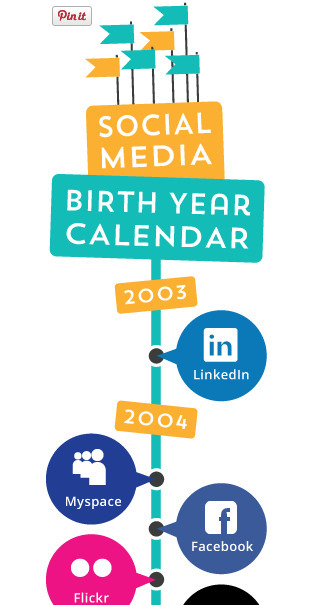
...To think of what “might be” a few years from now is barely fathomable but really exciting! I remember listening to the keynote speaker at the 1990 Seybold Conference talk about how books in the future would be enjoyed on electronic readers, and thinking, “not in my lifetime would electronic readers replace printed books.” We all know how that turned out.
Let’s go back and hit the high points from the past ten years. Below is a visual infographic timeline followed by a more detailed look at each year! Pay close attention to the ones that were launched in 2012; some of them have a lot of potential to be game changers!
Here's a quick list of do's and don'ts that will help you understand at a glance how to approach social selling and generate real results.
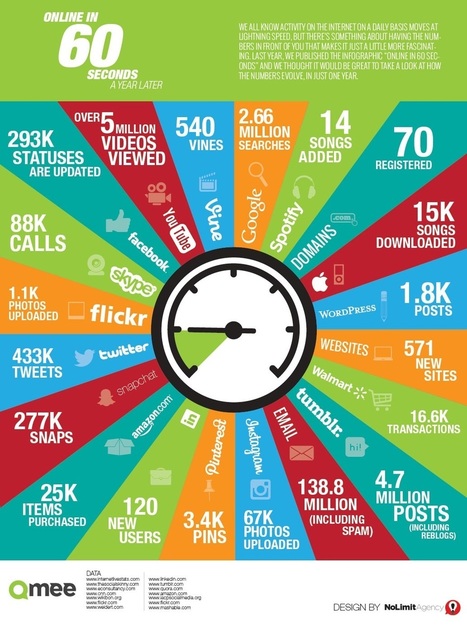
According an infographic from Qmee in 60 seconds, 293K statuses are updated on Facebook, WordPress bloggers share 1.8K new blog posts, web users download 15K songs, and Instagramers upload 67K photos.
"We all know activity on the Internet on a daily basis moves at lightening speed, but there's something about having the numbers in front of you that makes it just a little bit more fascinating."
This infographic looks at what happens in just one minute on social web...
|


![Holiday Shopping Goes Social [Infographic] | Crowdtap | World's Best Infographics | Scoop.it](https://img.scoop.it/5JicxFP5VIC4LfNcbKipgTl72eJkfbmt4t8yenImKBVvK0kTmF0xjctABnaLJIm9)


The expanding world of social media!
Et tant de possibilités...