


 Your new post is loading...

From
medium
As a marketer, your content strategy is very important. Blogs, articles, social media posts, slide presentations, etc. There are so many ways to market your content.
But in the last few years, infographics have caught the attention of online marketers and media professionals. They feature a combination of text, design, and images to convert complex data into an easy-to-read piece of content.With evolving visual communication, infographics are now focusing on driving flexibility, shareability, and audience engagement. The three trends that will help you in doing so are...


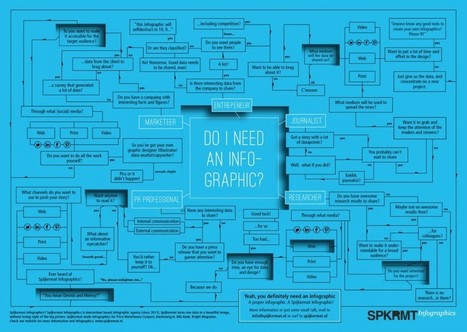

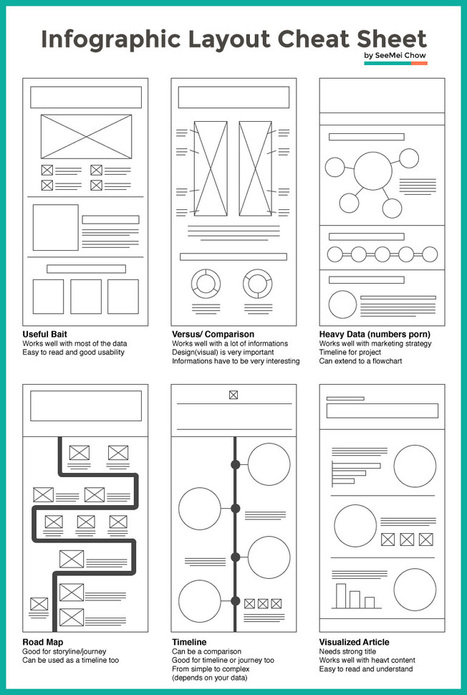


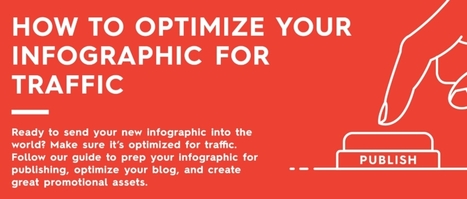

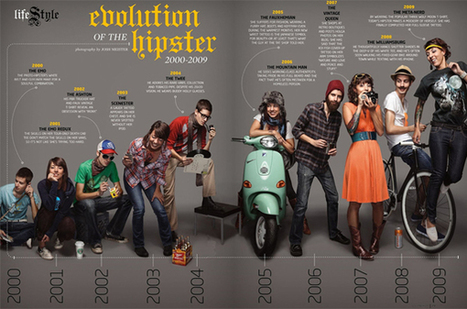


Three infographics trends to follow.