World's Best Infographics
10.6K views | +0 today
Follow
World's Best Infographics
Celebrating the FINE ART of visual communication in social marketing
Curated by Jeff Domansky
Your new post is loading...
Rescooped by Jeff Domansky from Public Relations & Social Marketing Insight
Scoop.it!

Data Visualization: How to Merge Form & Function & Make Great #Infographics

Data Visualization: How to Merge Form & Function & Make Great #Infographics | World's Best Infographics | Scoop.it

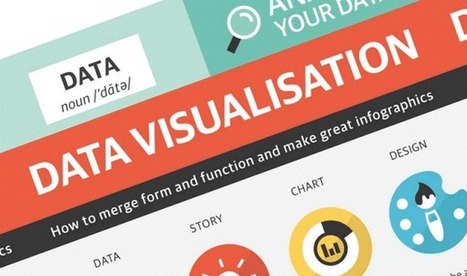
The following infographic, created by Zhenia Vasiliev, breaks down the basics of data visualization. It shows how beginners can merge form and function, and design meaningful infographics.


Key highlights:

-  Analyse your data: Analysis is the key. Before we can visualize the data we need to understand it.

-  Come up with a story: Story is finding a single strand of meaning in an endless sea of information. It has a beginning, middle and end.

-  Make it visible: Visualization is a creative act of making. Making the data visually elegant evident and engaging.

-  Entertain to educate: Good data design need to illuminate and inform the viewer, elucidate and illustrate the facts and stats....

Jeff Domansky's insight:

Useful tips on how to turn data into compelling content.

Jeff Domansky's curator insight, June 9, 2015 1:32 AM

Useful tips on how to turn data into compelling content.

Rescooped by Jeff Domansky from Public Relations & Social Marketing Insight
Scoop.it!

The 9 Best Infographics Of 2014

The 9 Best Infographics Of 2014 | World's Best Infographics | Scoop.it
Are you curious about what's going to happen in the next billion or so years? Well, lucky for you, we have an infographic to let you know every important event from now until then—and the next billion years after that, too.

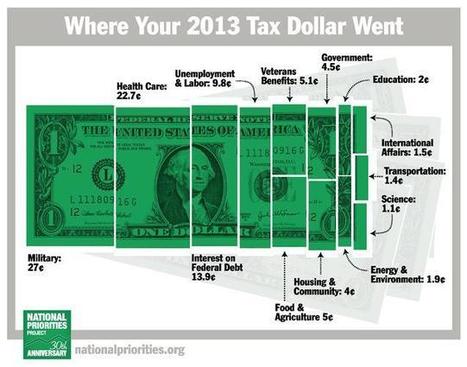
We can also show you how to eat healthy and explain your taxes to you. These are just a few of the most informative and fun infographics, visualizations, and other graphic stories that we've seen over the last year.

So pour over these charts and learn a little something (and, while you're at it, you can take a look at the ones we featured last year):
Jeff Domansky's insight:

Cool infographics.

Jeff Domansky's curator insight, January 2, 2015 5:04 PM

Cool infographics.

Marco Favero's curator insight, January 3, 2015 5:45 AM

aggiungi la tua intuizione ...

Rescooped by Jeff Domansky from Public Relations & Social Marketing Insight
Scoop.it!

Infographics Lie. Here's How to Spot the BS

Infographics Lie. Here's How to Spot the BS | World's Best Infographics | Scoop.it

We live in an age of Big: Big Computers, Big Data, and Big Lies.


Faced with an unprecedented torrent of information, data scientists have turned to the visual arts to make sense of big data. The result of this unlikely marriage—often called "data visualizations" or "infographics"—has repeatedly provided us with new and insightful perspectives on the world around us.


However, time and time again we have seen that data visualizations can easily be manipulated to lie. By misrepresenting, altering, or faking the data they visualize, data scientists can twist public opinion to their benefit and even profit at our expense.


We have a natural tendency to trust images more than text. As a result, we’re easily fooled by data visualizations. But fortunately, there are three easy steps we can follow to save ourselves from getting duped in the data deluge....

Jeff Domansky's insight:

Do infographics lie more than other types of news? It's an intriguing question.

Jeff Domansky's curator insight, January 3, 2015 1:03 AM

Do visuals lie more easily? Infographics are all over the place nowadays. How do you know which ones to trust? Follow these three easy steps to save yourself from getting duped.

Marco Favero's curator insight, January 3, 2015 6:49 AM

aggiungi la tua intuizione ...

Rescooped by Jeff Domansky from Public Relations & Social Marketing Insight
Scoop.it!

40 Creative Infographics for Designers and Developers | TheNeoDesign.com

40 Creative Infographics for Designers and Developers | TheNeoDesign.com | World's Best Infographics | Scoop.it

VMonths back we came up with the superb collection of nice, visually appealing infographics (Creative Infographics for Designers and Developers) witnessing which designers and developers would easily relate as each one of them was visual graphics talking about designers and developers.Here is our latest compilation 40 creative infographics for designers and developers. Hit a jump to take the glimpse of each....

Jeff Domansky's insight:

Great collection of info graphics to inspire you.

Jeff Domansky's curator insight, December 24, 2014 1:14 AM

Great list showcasing creative infographics for designers and developers that will inspire you, make you learn new things and much more.

Marco Favero's curator insight, December 24, 2014 6:17 AM

aggiungi la tua intuizione ...